TL;DR
claude --chromeor/chromeconnects Claude Code to your browser, and the moment it does, Chrome puts a bar on every tab saying Claude started debugging this browser. That bar is Chrome's doing, not Claude's, it is in none of the docs, and there are two ways to silence it.
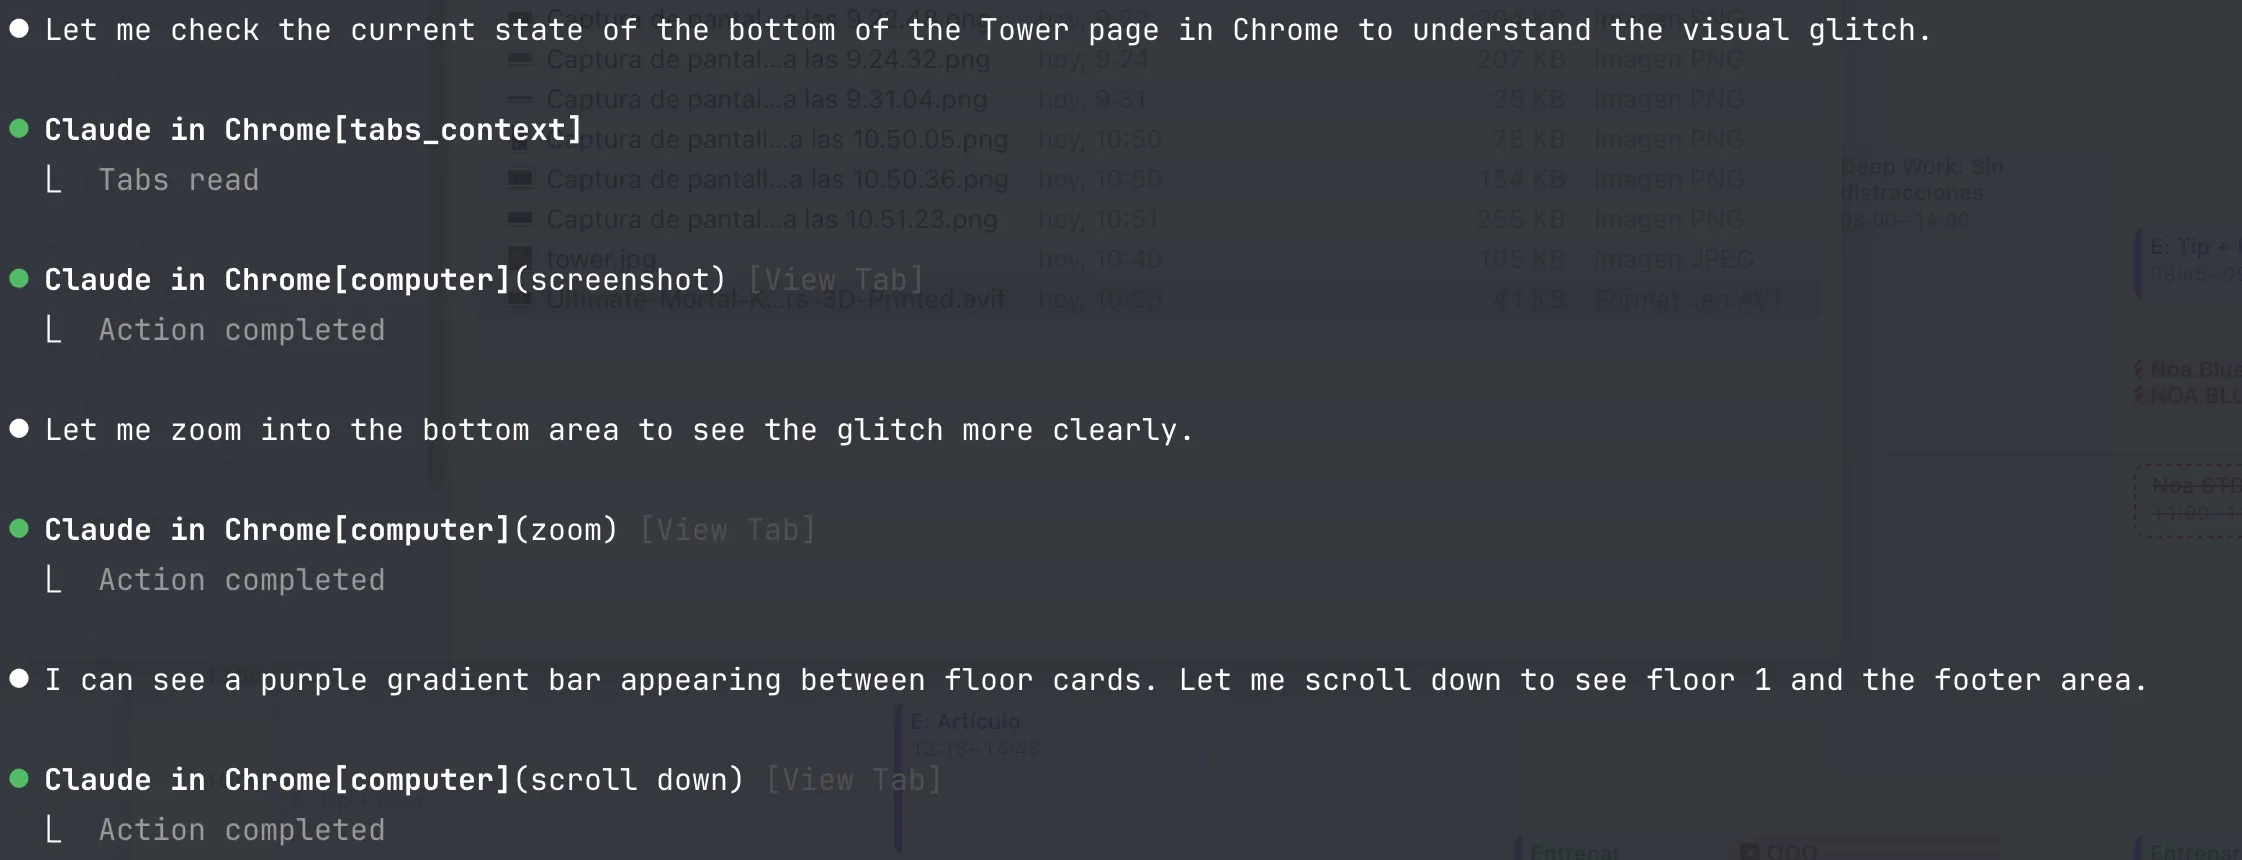
Claude Code integrates with the Claude in Chrome extension to give you browser automation directly from the CLI. Launch your app, ask Claude to test it, and it opens Chrome, navigates to your localhost, interacts with forms, reads console errors, and tells you what's broken — with access to the real DOM and your browser's login state.
It's fascinating to watch it work: opening tabs, scrolling, launching modals, typing search terms, and compiling results. It's still sometimes slow. It still sometimes fails. But the key word is still. This improves with every release, and the direction is clear.
Result:
> claude --chrome

Chrome integration enabled

> Open localhost:3000, fill out the registration form
  with invalid data and tell me if the error messages
  appear correctly

⏺ Opening new tab → localhost:3000
  Clicking "Sign up"...
  Typing invalid email...
  Form submitted — 3 validation errors detected:
  - Email format invalid
  - Password too short
  - Terms not accepted
"Claude started debugging this browser": what the bar actually is
The first time Claude touches your browser, Chrome drops a bar across every open tab, not just the one Claude is working in, and it stays up for as long as the session is attached.
It is not a warning about Claude. It is what Chrome shows for any extension that attaches through the chrome.debugger API, the same Chrome DevTools Protocol your own DevTools panel speaks. Claude Code drives the browser through the Claude in Chrome extension, that extension attaches over CDP, so the bar fires.
The template lives in Chrome's own resource bundle and it reads:
"$1" started debugging this browser
So what is actually on screen is "Claude" started debugging this browser, with the quotes around the extension name. Run Chrome in Spanish and the same string drops them: Claude empezó a depurar este navegador.
Two things worth knowing:
- Nothing has gone wrong. The bar is informational. It appears on the first browser action and stays until the debugger detaches.
- It is undocumented. The official Chrome integration page ships a troubleshooting section and a table of common error messages, and the bar is in neither. Issue #69287 asked Anthropic for a built-in way to suppress it and was closed as not planned, so every fix is on your side.
How to stop the bar
Launch Chrome with the silent switch. Chrome ships a flag that suppresses the infobar for extension debugger sessions:
open -a "Google Chrome" --args --silent-debugger-extension-api
Quit Chrome completely first (Cmd+Q, not just closing the window) or the flag does nothing, and it applies per launch, so opening Chrome from the Dock brings the bar back.
How far I checked this one, so you know what you are getting: the switch does ship in the Chrome 150 binary, and passing it this way does reach the browser process (I read it back off the running process on a throwaway profile). What I did not verify is the suppression itself, because that needs the extension attached in a live session. Silencing the bar is what people report works, not something I watched happen.
Or force-install the extension by policy. Extensions installed through the ExtensionInstallForcelist enterprise policy never raise the bar at all. Heavier to set up, but it survives restarts and does not depend on how you launch Chrome.
One caveat before you silence it: that bar is the only visible sign that something holds full DevTools access to your browser, with your cookies and every session you are logged into. Turning it off is reasonable on a machine where you know exactly what is attached. It is a worse idea on a shared one.
How to set it up
1. Prerequisites
- Google Chrome or Microsoft Edge
- Claude in Chrome extension v1.0.36 or higher
- Claude Code v2.0.73+
- Direct Anthropic plan (Pro, Max, Teams, or Enterprise)
2. Launch with Chrome
claude --chrome
Or within an existing session:
/chrome
3. Enable by default (optional)
Run /chrome and select "Enabled by default" to skip passing --chrome each session. Note this increases context usage since browser tools are always loaded.
Claude Code can also offer it to you unprompted, the moment it detects the extension. Before you accept, it is worth knowing what that yes actually switches on and what your permission mode does with it, because in Don't Ask the actions that would ask for permission get skipped in silence.
Reference
| Capability | What it does |
|---|---|
| Live debugging | Read console errors and DOM state, then fix the code |
| Design verification | Build UI and visually compare in the browser. Pair with the Frontend Design Skill so the UI you're about to debug isn't generic AI slop |
| Web app testing | Test forms, user flows, and visual regressions |
| Authenticated apps | Interact with Google Docs, Gmail, Notion — uses your active session. Torn between this and Chrome DevTools MCP? Here's the map |
| Data extraction | Pull structured data from web pages and save locally |
| Task automation | Automate data entry, forms, and multi-site workflows |
| Session recording | Record interactions as GIFs to document or share |
| Command | Action |
|---|---|
claude --chrome |
Launch Claude Code with Chrome enabled |
/chrome |
Enable/manage Chrome within a session |
This is the CLI route. On Desktop there is a browser inside the app itself that needs no extension, though it does not carry your logins either.
Official docs: Use Claude Code with Chrome (beta)