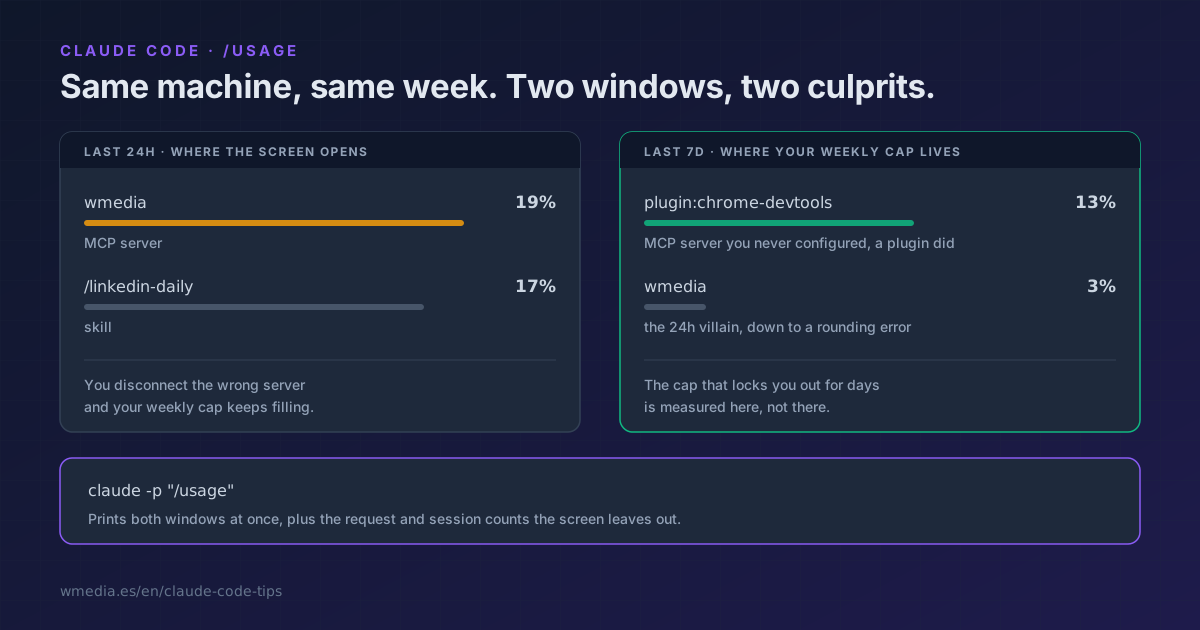
TL;DR Don't open the screen, run
claude -p "/usage"instead: it prints both windows at once. Then act on the name in the 7-day block, not the 24-hour one, because the cap that locks you out for days is the weekly one.
When you run out of quota, the usual suspect is the model. Opus costs more, sessions get long, tough luck. That is where most people stop, because until recently there was nothing else to look at.
/usage now carries a block titled What's contributing to your limits usage? that splits your recent consumption across things with actual names: your skills, your subagents, your plugins and your MCP servers, each with a percentage. It also flags five behaviors (long context, cache misses, parallel sessions, sessions running over eight hours, and subagent-heavy sessions), but only when one of them accounts for 10% or more. The name lists skip that filter entirely: a skill shows up at 1%.
Result:
$ claude -p "/usage"

Current week (all models): 11% used · resets Aug 20 at 8pm (Europe/Madrid)

What's contributing to your limits usage?
Approximate, based on local sessions on this machine — does not include other devices or claude.ai. Behaviors are independent characteristics, not a breakdown.

Last 24h · 155 requests · 3 sessions
  91% of your usage was at >150k context
  Top skills: /linkedin-daily 17%, /claude-code-tip 12%
  Top MCP servers: wmedia 19%

Last 7d · 2699 requests · 10 sessions
  88% of your usage came from sessions active for 8+ hours
  83% of your usage was at >150k context
  54% of your usage came from subagent-heavy sessions
  Top skills: /linkedin-daily 3%, /claude-code-tip 2%, /evaluate 1%
  Top subagents: general-purpose 5%
  Top MCP servers: plugin:chrome-devtools-mcp:chrome-devtools 13%, wmedia 3%
That is my machine, untouched. And look at what the two windows do: they disagree.
Over the last 24 hours the heaviest MCP server is wmedia at 19%, and my publishing skill takes 17%. Stop reading there and I disconnect wmedia and call it a day. But across 7 days wmedia drops to 3% and the top spot goes to plugin:chrome-devtools-mcp:chrome-devtools at 13%, a server I never configured by hand. A plugin brought it in, which is why the name starts with plugin:.
One atypical day is all it takes to convict the wrong suspect. Claude Code knows it too: when nothing in a window clears 10%, it sends you to the other one.
Nothing over 10% in this period — try the other window.
Why the week beats the day
You have two caps. The five-hour window, which you can wait out over a coffee, and the weekly one, which locks you out until its reset date. The second is the one that hurts.
The interactive /usage panel always opens on the last 24 hours. This is not a saved preference or something your config decides: it starts on the day, every time, and you have to press w for the week. So the instrument it hands you by default is calibrated for the wrong problem.
One detail worth keeping straight: Last 7d is a rolling seven days, not your billing week. Your weekly bar resets on a fixed date. The two periods look alike and are not the same span.
How to use it
1. Ask for both windows at once
claude -p "/usage"
No TUI, no keystrokes. It prints the 24 hours and the 7 days back to back, and adds the request and session count for each period, which the interactive screen leaves out.
What this route does not print, if you are on a subscription, is the Session block. That is where the Prompt cache (main) line lives, the one that tells you whether your cache is working and what broke it. For that one you have to open the screen inside the session.
2. Read the 7-day block only
Skip the 24-hour one. Find the first line carrying a proper name: a skill, a subagent, a plugin or an MCP server. That is your suspect.
3. Apply the fix the screen already gives you
Every line ships with one. If it is an MCP server, its tool results sit in your context for the rest of the session: /compact flushes them, and /mcp lets you switch off the ones you are not using in that project. If it is a skill, tighten its scope or give it a cheaper model in its frontmatter. If what got flagged is long context, the fix is /clear when you switch tasks instead of dragging an eight-hour conversation behind you.
What it can name
| Shows up as | What it is | Filter |
|---|---|---|
Top skills |
Your skills, / prefixed |
No minimum, up to 8 |
Top subagents |
Subagents by name | No minimum, up to 8 |
Top plugins |
Installed plugins | No minimum, up to 8 |
Top MCP servers |
MCP servers, yours or a plugin's | No minimum, up to 8 |
>150k context |
Sessions carrying a heavy context | Only at 10% or more |
>100k-token cache miss |
Returning to a cold session and reprocessing it | Only at 10% or more |
subagent-heavy sessions |
Sessions that spawn a lot of subagents | Only at 10% or more |
4+ sessions ran in parallel |
Several sessions against the same cap | Only at 10% or more |
sessions active for 8+ hours |
Sessions left open all day | Only at 10% or more |
What these numbers are not
They are not an audited bill. The block says so itself: the figures come from local sessions on that machine, so anything you did on another device or on claude.ai is missing. The five behaviors are independent characteristics rather than a breakdown, which is why they can add up past a hundred between them.
A version warning too: before v2.1.222, a single call to an MCP server was enough for Claude Code to attribute every later request to it, inflating its share. If you looked at this screen a few weeks ago and blamed a server, look again.
There is also one angle this screen cannot cover: Top skills only names skills that actually ran. The ones you never invoked consume nothing, so they never appear here, and they still take up their line in the prompt on every turn. For those, there is /skill-doctor.
And if what got flagged is the cache miss, this screen tells you it happened but not what caused it or when. That comes from the Prompt cache (main) line in /cost, which names the cause of your last miss.
For the rest of the picture: /usage and /stats as gauges tell you how much is left, the status line keeps it in front of you without typing anything, and if context is what got flagged, connecting twenty MCP servers without eating your context and the auto-compact window are the two levers left. And if what got flagged is subagent-heavy sessions, like the 54% in my own capture above, the lever is sizing your workflows before you launch them.
Official docs: Manage costs effectively